This Is Why Data Analysts Are Now Decision Architects
For many years, data analysts spent most of their time collecting information, tracking key metrics and building reports. Their role was mainly about describing the past: explaining what happened last quarter or last month through static dashboards and charts. This work was valuable but often slow and reactive. Businesses can no longer afford to look backwards alone. They need to anticipate what will happen next and make decisions based on that forecast.
AI systems are changing the world of data engineering and the role of a data scientist. By automating manual reporting and handling complex analysis at speed, AI is moving the role away from simply reporting numbers. Analysts are becoming decision architects: people who help shape strategy by turning data into clear recommendations about what to do next.
If you are in data analytics, you will have noticed that we’ve gone from terms like “Business Intelligence” or “Management Information” to a set of new terms which we will discuss in this blog. Those are:
- Augmented Analytics: How AI democratises data by automating preparation and accelerating insight discovery.
- Predictive and Prescriptive Power: The evolution from forecasting future trends to recommending clear, optimal actions.
- AI-Driven Visualisation: How intelligent systems design charts for maximum clarity and instant comprehension.
What are augmented analytics?
As data people, we know how much of your time is lost to data preparation: Maintaining databases, cleaning spreadsheets, blending sources and validating fields. It can take up most of your week before you even start the real work.
With augmented analytics, that process changes. AI becomes your co-pilot, taking care of the grunt work in the background. It will automate data quality checks, detect outliers, and build models, all in record time. AI scans your datasets at a scale you could never do manually. It surfaces correlations, anomalies and hidden trends you might otherwise miss. You don’t need to dig through thousands of rows because insights are presented to you, ready to be acted on. With your time and resources freed up, you can now jump straight to interpretation and business strategy.
This shift also opens data up to the rest of your organisation. Augmented analytics turns colleagues without coding skills into “citizen data scientists”. They can explore dashboards, run queries and make faster, evidence-based decisions without clamouring for your time or that of your team.
This is a game-changer on many levels because you’re no longer stuck as the data gatekeeper. You get to spend more time advising leaders, shaping predictive models and influencing strategy. Instead of reporting on the past, your role now is to give the information that will shape the future of the business.
How predictive and prescriptive analytics drive business decisions
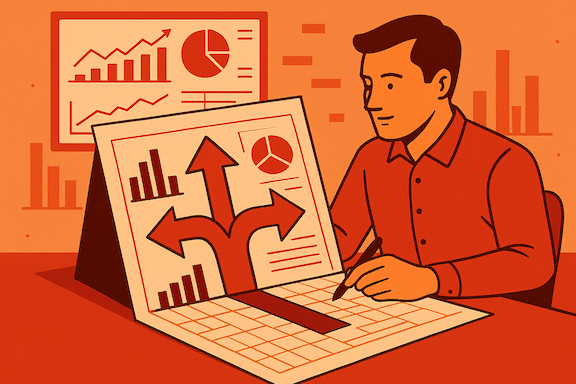
As we’ve said above, the real value of AI in analytics is not no longer in simply reporting what has already happened. Traditionally, analytics starts with describing events (what happened) and then diagnosing them (why it happened). With AI, you can now go further: predicting and prescribing what comes next.
Predictive analytics gives you the first step into this future view. By applying machine learning models to past data, you can forecast outcomes with much greater accuracy. Instead of only reporting on last quarter’s sales, you can anticipate customer churn, revenue shifts or even system failures before they occur. These models uncover patterns you might never see on your own, giving you a forward-looking view that supports better planning.
Prescriptive analytics push this even more. This is where AI doesn’t just predict an event: it tells you what action to take. For example, rather than warning that stock levels are about to fall, a prescriptive system will recommend when to reorder and in what quantity, balancing cost with availability. This is a paradigm shift: you move from reacting to problems to actively shaping outcomes.
For you as an analyst, this is a shift in role. Instead of being a reporter of past trends, you become the one advising on the next move, armed with Data and Intelligence driven recommendations.
Why should you use AI for smarter data visualisation?
We all know it: the way you present data can make or break its impact. Even the most valuable insight risks being overlooked if the chart is confusing or cluttered. For years, choosing the right visualisation was down to your judgement and experience. But not everyone has a background in data science, so it was difficult to cater to diverse sets of stakeholders.
AI is now helping with this. Think of it as a design assistant that doesn’t just draw charts but suggests the best way to show your data. It looks at the structure of your dataset, the variables involved and the question you’re trying to answer. If you need to show a trend, it might recommend a line chart. If you’re comparing parts to a whole, it could suggest a stacked bar or a pie chart. The idea is to get you to the clearest answer faster.
AI also improves the final design. It can highlight anomalies automatically, apply accessible colour palettes and add annotations that guide the reader to what matters most. Instead of scanning a dense graph to spot the takeaway, the key insight is brought to the surface.
The result is a smoother experience for decision-makers. They see the message clearly, without extra effort, and can act on it straight away.
How should you upskill yourself and your team to use AI for data analytics?
So let’s talk now about the elephant in the room: Now that you (and your team) no longer need to spend most of your time writing scripts or building charts by hand, how can you prepare for this new era? What are the skills you need to keep pace and truly take advantage of the new technology at your disposal?
Use AI tools hands-on
Spend time working with AI-enabled business intelligence platforms. Tools like ThoughtSpot, Power BI Copilot and Tableau’s AI features can handle natural language queries, automated discovery and search-driven analytics. The more familiar you are with these automation functions, the more effectively you can apply them in practice. This is a new set of technical skills and knowledge that you should have when leading any AI project.
Build AI literacy
It’s not enough to use the tools, you need to understand how they work, where they fall short and how to challenge their outputs. This includes recognising bias, data dependencies and ethical considerations. Courses such as Andrew Ng’s AI For Everyone or Google’s AI Essentials are good starting points. For business leaders, programmes like Harvard’s AI Essentials for Business provide valuable context. This kind of literacy will open up a new career path in the age of Artificial Intelligence.
Strengthen strategy and storytelling
With preparation automated, your role becomes that of consultant and storyteller. Focus training on simplifying complex insights, using data to guide strategic choices and building narratives that drive the decision making process. Certifications like the Certified Analytics Professional (CAP), or advanced training in modelling with Python or SAS, can help formalise and deepen these skills.
Key takeaways: How the role of data analytics is changing
- The role of the data analyst is changing: Your focus is shifting from reporting on the past to predicting and shaping the future of business performance.
- Augmented analytics is reshaping data work: By automating data cleaning, validation and discovery, it reduces manual effort and allows you to focus on interpretation and strategy.
- Predictive analytics brings foresight: Using machine learning, it forecasts future outcomes such as customer churn, revenue changes or system failures, helping you prepare before problems arise. This in turn gives a whole new meaning to business analytics.
- Prescriptive analytics turns insight into action: Beyond prediction, it recommends the best steps to achieve business goals. For example, it can inform you about when and how much stock to reorder for your business.
- AI-driven visualisation improves comprehension: Algorithms choose the most effective charts, highlight anomalies and apply design features that make insights clearer and easier to act on.
- Upskilling is key to becoming a decision architect: Mastering AI-native tools, developing AI literacy and strengthening storytelling skills ensures you and your team can lead with data.
Need expert help with your data analytics?
marketing service
I must say this article is extremely well written, insightful, and packed with valuable knowledge that shows the author’s deep expertise on the subject, and I truly appreciate the time and effort that has gone into creating such high-quality content because it is not only helpful but also inspiring for readers like me who are always looking for trustworthy resources online. Keep up the good work and write more. i am a follower.
Dania Kadi
Thank you for your kind comment. We’re glad you found this article helpful. Please do feel free to propose any topics you’d like us to write about.
Henry Stehr
Your blog is a constant source of inspiration for me. Your passion for your subject matter is palpable, and it’s clear that you pour your heart and soul into every post. Keep up the incredible work!
Comments are closed.


3 comments